



An analyst running a long assay series notices that the standard curve built from a peptide reference has flattened slightly over six months. Every purchase of the material came with an acceptable purity figure. Nothing on any single document looks wrong. The question the analyst actually needs answered is not “did this material pass?” but “is this material the same as last time?”, and those are different questions with different evidence behind them.
This article looks at lot-to-lot variation: what it is, how trending detects it, why a single analytical report cannot show it, and what a laboratory buyer can realistically do about it.
Passing and consistent are not the same claim
A specification defines what is acceptable. It is usually set wide enough to accommodate normal manufacturing and measurement scatter. A process, however, typically operates in a much narrower band inside that specification. A result can sit comfortably inside the specification while falling well outside the range the process normally produces, and that combination is often the first sign that something upstream has changed.
Trending is the practice of plotting one attribute across successive production runs in the order they were made. Formal statistical process control adds control limits calculated from the process’s own history rather than from the specification. The specification answers “is this acceptable?”; the control limits answer “is this normal for us?”.
Patterns a trend chart reveals
Consider purity values of 99.3, 99.0, 98.9 and 98.6 across four consecutive runs, against a specification of not less than 98.0%. Each passes. Read individually, none raises a question. Read in sequence, they describe a steady decline.
| Pattern | What the series looks like | Typical explanations |
|---|---|---|
| Gradual drift | Values move steadily in one direction | Slow change in a reagent, column or process step |
| Sudden shift | Level changes abruptly, then holds | New raw material source, new resin, new equipment or a changed procedure |
| Growing scatter | Average holds while spread widens | Loss of control; the edge of the distribution reaches the limit before the average does |
Headline purity is often not the earliest signal. Individual impurity entries tend to move first. A single deletion sequence creeping from a few tenths of a percent upward over several runs points at a coupling step losing efficiency long before the total purity figure looks unusual. The families of impurity involved are covered in peptide synthesis impurities.
Two sources of scatter in every number
Every reported value combines two kinds of variation. The material varies from run to run. The analytical method varies from determination to determination. The printed figure is one draw from the combination, and it does not say which part contributed what.
So a move from 99.1% to 98.4% between two runs might be a real change in the product, or it might be a stable product viewed through a method whose repeatability spans most of a percentage point. Separating the two requires repeated measurements of the same material under the same method, which is internal laboratory work that a buyer never sees. This is one reason a buyer should be cautious about reading meaning into small differences between two documents.
Why one report cannot show a trend
A trend needs a history, and the production history belongs to whoever makes the material. An analytical report describes a narrow thing precisely: what one method found in one sample on one occasion. It does not promise that the next production run will match, that the rest of the material matches the portion sampled, or that nothing has changed since the test. That narrowness is not a defect of the document; it is what the document is. Our guide to the peptide certificate of analysis sets out what such a report can and cannot establish.
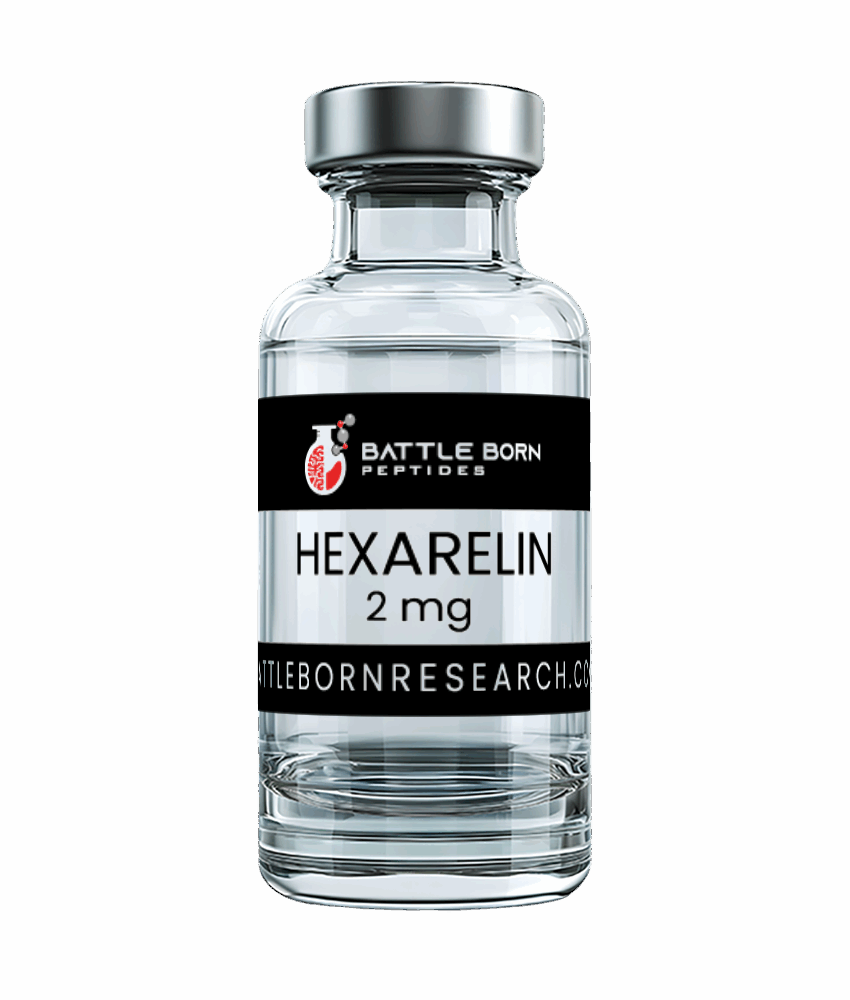
It is worth being clear about how this applies at Battle Born. The catalog publishes an independent reverse-phase HPLC analysis for each product individually. Testing is per product, not every production batch, and vials carry no batch or lot numbers; a vial is matched to its published test by crimp and cap colour, as explained in matching a vial to its published test. A published product test is therefore a characterization of that product, not a record of every run, and a buyer who needs run-to-run consistency data for a sensitive series should plan to generate some of it in-house.
Building your own partial record
A laboratory that buys the same material repeatedly can assemble a useful, if incomplete, series of its own. A practical checklist:
- File every receipt consistently. Record the product, the date received, the crimp and cap colour, the published test that applied at the time, and where the material was stored. The discipline is described in recordkeeping for research chemical purchases.
- Run an in-house check on each receipt. Even a simple reverse-phase run on your own system, using the same method every time, gives comparable points.
- Compare like with like. A value from a different laboratory or a different method is not another point on your series.
- Watch impurity peaks, not just the headline figure. A new or growing minor peak is usually more informative than a small change in total purity.
- Keep expectations proportionate. A difference that sits within your method’s repeatability is not evidence of change.
- Track your assay performance alongside. Control values and standard curves in your own experiments are part of the same record.
Two limits remain. A buyer’s series cannot separate product variation from method variation without replicate work, and it only ever includes material that was actually sold.
Questions
If every result passes, why does trending matter?
Because a sequence of passing results can still show drift, a step change or widening scatter, which may indicate a process change before any result fails.
Can a single analytical report show consistency?
No. It describes one sample tested on one occasion. Consistency is a property of a series.
How do I relate a Battle Born vial to its test without a lot number?
By crimp and cap colour, which matches the vial to the published test for that product.
What is the most sensitive thing to watch across purchases?
Individual impurity peaks measured by one consistent method, together with the behavior of controls in your own assays.
Research use only. All products supplied by Battle Born Peptides are laboratory reference materials for in-vitro research and analytical use by qualified professionals. They are not drugs, foods, dietary supplements, cosmetics or medical devices; they are not approved by the FDA or any other regulator for use in humans or animals; and they are not intended to diagnose, treat, cure, mitigate or prevent any disease, or to affect the structure or any function of the body of humans or animals. Nothing in this article is preparation, handling or dosing guidance. See our full research-use terms.